
Overview
Implementing effective COVID-19 testing protocols is an important component of a risk management strategy to enable schools and businesses to safely re-open and return to a sense of normalcy. However, little guidance exists on the best approach for testing, how to best balance cost and test selection, and how to adjust testing strategies based on changes in disease prevalence.
Pooling mixes several samples together in a batch and then tests the pooled sample with a diagnostic test. This approach increases the number of individuals that can be tested using the same amount of resources.
A team from OptumLabs modeled various scenarios to identify and compare a range of effective and practical individual and pooled testing strategies that can support “best fit” decisions based on community circumstances. Their results were recently published in PLoS One.
Research
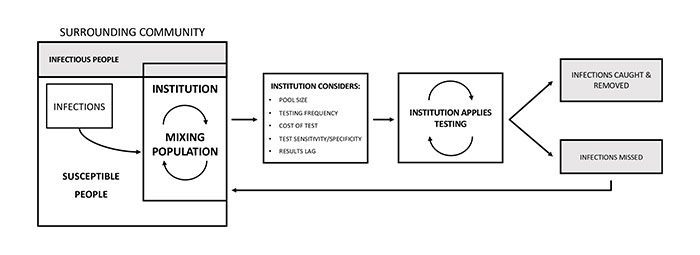
The research team built a model that simulates both disease transmission inside the institution as well as the possibility of infection introduced from the surrounding community.
The resulting framework captures the impact of variables such as test sensitivity, testing frequency, results lag, sample pooling, disease prevalence, symptom checking and test cost on outcomes, including reduction in infections and false positives.
-
OR
Using this model in communities with high and low prevalence of COVID-19, the team looked at multiple combinations of key variables to simulate a variety of scenarios:
- Test sensitivities and specificities ranging from 0% to 100%
- Delays in receiving results ranging from 0 to 7 days
- Testing frequencies ranging from every day to every 14 days
Testing every 3 days versus every 14 days (even with a lower sensitivity test) reduced the disease burden substantially. As the testing frequency increased, even with a two-day delay in results, the number of missed infections went down rapidly to a 99% reduction from no testing at all to a daily testing frequency.
-
OR
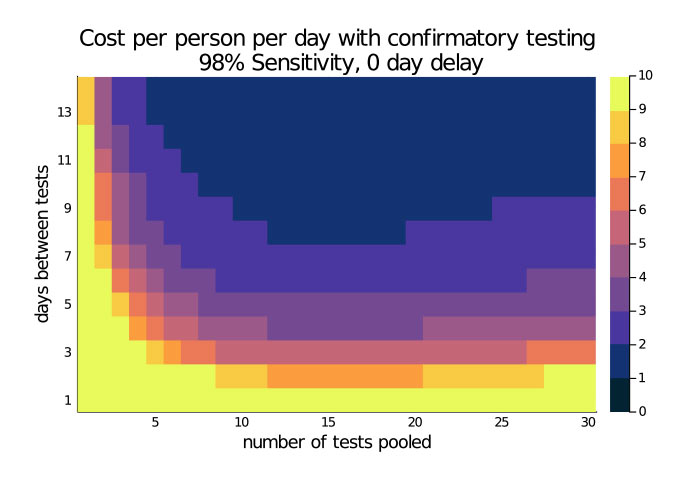
The research team also looked at testing strategies that incorporate the use of pooled tests in samples of 2, 5, 10 and 30. Pooling provided cost savings and made a high-frequency approach practical.
In one high-performing strategy, testing every 3 days among pools of 30 people with a 98% sensitive test and no delay in results and no confirmatory tests yielded per person per day costs as low as $1.50. This contrasts with a cost of $20.00 per person day for 60% sensitive test used daily with no confirmatory tests.
Applying the model to real-life scenarios
This research demonstrates how test sensitivity, pooling approaches and frequency modeling can guide institutions on best-fit testing strategies that match their needs and constraints. Organizations can apply this model to determine an appropriate testing strategy that enables them to safely stay open during the pandemic.
An easy-to-use, web-based simulator on the OptumLabs United in Research website is now available that leverages the computational code used in the model to further help businesses and schools understand how different test strategies will affect their budget and the overall rate of infection.
This tool allows users to compare pooling, test accuracy, testing frequency and costs to choose the best strategy for their community and to use the model as frequently as desired based on changing characteristics of the pandemic within their communities or businesses.
