
To address the opioid crisis, build a comprehensive national framework
January 25, 2018
By Darshak Sanghavi, MD; Aylin Altan, PhD; Christopher Hane, PhD; Paul Bleicher, MD, PhD, OptumLabs
Among the myriad of challenges around the U.S. opioid epidemic is the lack of consistent, data-driven ways for the health system to measure and respond to it. That’s why OptumLabs collaborated with a panel of national clinical and public health experts to develop a comprehensive framework of 29 claims-based measures that are organized by four opioid-related domains: prevention, pain management, opioid use disorder treatment, and maternal and child health. These metrics have been shared with diverse stakeholders in various forms, and have garnered significant interest for their potential to guide a more holistic approach to evaluating and improving efforts to tackle this public health crisis. We are excited to share them with you! – Editor
This following piece first appeared in the Health Affairs Blog on December 18, 2017.
The annual rate of opioid-related deaths in the United States will surpass the historic peak annual death rates from motor vehicle accidents, HIV infections, and firearms to become the leading cause of death for people less than 50 years of age. The National Vital Statistics System reported roughly 64,000 deaths from drug overdoses in 2016 and year-to-year relative rate increases of more than 20 percent. Responding to this epidemic with such dramatic increases, the Department of Health and Human Services declared the national opioid crisis a public health emergency on October 26, in conjunction with President Donald Trump’s pronouncement on the same day.
The current opioid crisis came after substantial increases in per-capita frequency and dosages of prescription opioids beginning in the late-1990s. Researchers hypothesize the increases were driven in part by efforts to recognize pain as the fifth vital sign as codified by the Joint Commission in 2001, pharmaceutical marketing practices, and lack of recognition of the risks of dependence and addiction with prolonged use. According to the Centers for Disease Control and Prevention (CDC), when averaged nationally, roughly one prescription for opioids is written for every person in the United States annually.
Current gaps and opportunities in quality metrics
The epidemic nature of the opioid crisis and its immense complexity has exposed important gaps in the ability of the health care system to respond in a data-driven manner. Typically, federally-endorsed performance measures are developed to track and address key health care processes or outcomes targeted for improvement using blunt payment incentives, which understandably require a high degree of evidence and testing prior to widespread deployment. The development process is not typically geared to rapid-cycle quality improvement programs, which can be deployed via education, quality improvement, comparison reporting, and value-based payment incentives as has been demonstrated in the private sector. As a result, formal federal measure development has not kept pace with the rapid cadence of the opioid epidemic.
For example, the Pharmacy Quality Alliance developed three opioid misuse measures in 2015 (targeted towards identifying high frequency/dosage prescribers or towards “doctor-shopping” patients) and these measures did not complete the endorsement process of the National Quality Forum (NQF) until 2017. Broad adoption by federal payment programs may take several more years, during which time contributing prescribing trends could continue. Over a year ago, the CDC released guidelines on the appropriate dosing of opioids for pain, and the former U.S. Surgeon General mailed a letter to 2.3 million clinicians on the same topic, but no endorsed quality measure to assist with this recommendation has been made widely available.
The need for a comprehensive quality measurement framework examining the impact of the epidemic from many vantage points has particular timeliness, as the White House opioid commission recently recommended that the nation "invest only in those programs that achieve quantifiable goals and metrics."
OptumLabs, a collaborative research and innovation center, embarked on a five-month program to develop a comprehensive framework of 29 claims-based measures for the opioid crisis. The measure set for this program benefitted from the input of a panel of national clinical and public health experts, including representatives from the CDC and the Substance Abuse and Mental Health Services Administration. Four key domains for the metrics were identified: prevention, appropriate acute and chronic pain treatment, Opioid Use Disorder (OUD) treatment, and maternal/child health. Where possible, measures were abstracted from publically available specifications which were refined as needed by expert coding teams. The measures were calculated using the OptumLabs Data Warehouse, which includes de-identified integrated pharmacy, medical claims, and enrollment data from a geographically diverse population of approximately 150 million United States residents currently or previously enrolled in commercial and Medicare Advantage programs. The measures are described in Exhibit 1 and technical specifications are described in a supplemental index.
Exhibit 1: Comprehensive opioid use quality measure framework and annual trends, 2016
| # Measure | 2016 |
| Enrollees meeting inclusion/exclusion criteriaa | 5,568,625 |
| Prevention | |
| Primary outcome measures | |
| 1. New opioid fillers per 1000 enrollees | 122 |
| 2. Initial opioid prescription compliant with CDC recommendations (composite)b | 55.4% |
| 3. New opioid fillers who avoid chronic use | 97.9% |
| 4. Prevalence of opioid overdose (OD) per 100,000 person-years | 35.9 |
| Secondary outcome measures | |
| 5. Initial opioid prescription is prescribed while patient is not exposed to benzodiazepines (component of primary measure #2) | 91.1% |
| 6. Initial prescription is not for methadone (component of primary measure #2) | 100% |
| 7. Initial opioid prescription is for short acting formulation (component of primary measure #2) | 99.6% |
| 8. Initial prescription is for <50MME/day (component of primary measure #2) | 77.2% |
| 9. Initial opioid prescription is for <=7 days supply (component of primary measure #2) | 79.7% |
| 10. No use of opioids for new low back pain patients | 87.1% |
| 11. No concurrent opioid and benzodiazepine use | 78.0% |
| 12. Appropriate contact with provider before second opioid prescription | 54.0% |
| Pain management | |
| Primary outcome measures | |
| 13. Chronic pain treatment with opioids is optimally managed (composite)c | 9.4% |
| 14. Avoidance of breakthrough post-surgical pain leading to ED visit and new opioid presription | 95.3% |
| Secondary outcome measures | |
| 15. Appropriate contact with provider among chronic opioid users (component of primary measure #13) | 95.1% |
| 16. No ED visit for breakthrough pain among chronic opioid users (component of primary measure #13) | 85.3% |
| 17. Evidence of non-opioid pharmacological treatment for pain among chronic opioid users (component of primary measure #13) | 45.9% |
| 18. Evidence of non-pharmacological therapy for pain among chronic opioid users (component of primary measure #13) | 23.8% |
| Opioid use disorder (OUD) treatment | |
| Primary outcome measures | |
| 19. Evidence of medication-assisted treatment (MAT) among patients with opioid use disorder (OUD) or OD | 27.8% |
| 20. Prevalence of OUD per 1000 person-years | 8.0 |
| Secondary outcome measures | |
| 21. Evidence of MAT following OD | 10.8% |
| 22. Evidence of naloxone fill among patients with OUD or OD | 0.7% |
| 23. No opioid prescription following any OUD or OD diagnosis | 41.0% |
| Maternal, infant & child health | |
| Primary outcome measures | |
| 24. Percentage of infants with NAS born to mothers on MAT | 20.6% |
| 25. Initial opioid prescription compliant with CDC recommendations for patients under 18y age (composite) | 68.6% |
| 26. Prevalence of OD per 100,000 person-years under 18y age | 7.2 |
| Secondary outcome measures | |
| 27. Cases per 1,000 live births of infants born with neonatal abstinence syndrome (NAS) | 1.2 |
| 28. New opioid filler per 1,000 enrollees under 18y age | 36 |
| 29. Prevalence of OUD per 1,000 person-years under 18y age | 0.21 |
Source: OptumLabs Data Warehouse. Note: aIncludes commercial and Medicare Advantage health plan enrollees with two years of continuous enrollment in medical and pharmacy coverage, no evidence of active cancer treatments, and not in long-term or palliative care. Denominators vary by measure and are noted for composite measures. bNumber of new opioid users in 2016: 750,594. cNumber of chronic opioid users in 2016: 311,870.
Results of comprehensive framework development
Related to the prevention rubric of Exhibit 1, data from 2016 shows that the rate of compliance with CDC-recommended prescribing for a first opioid fill was approximately 55% and the rates of new opioid fills was 122 per 1,000 enrollees. To better explore the distribution, the measures were computed at the county level and found to be nearly normally distributed (See Exhibit 2), with substantial and meaningful variation, suggesting that local factors may strongly impact prescribing volume and guideline-adherence. (Similar variation was seen among several measures; data not shown.)
Exhibit 2: Distribution of initial opioid prescriptions in compliance with CDC recommendations and rates of new prescriptions at the county level, 2016
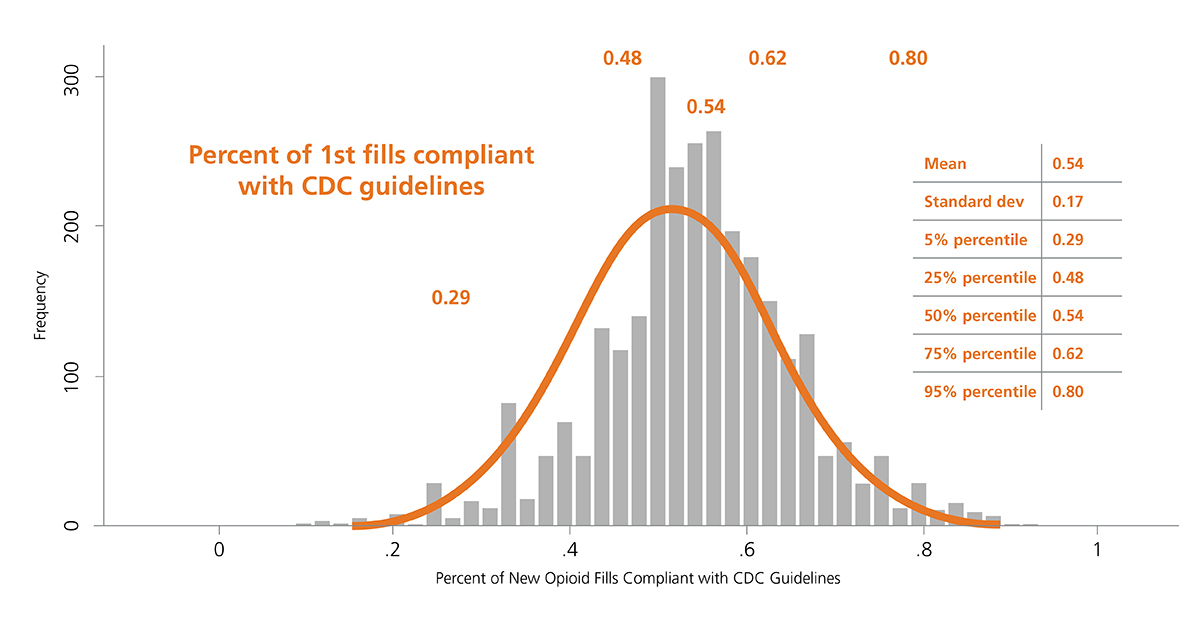
Source: OptumLabs Data Warehouse.
In 2016, the year the CDC issued guidance for prescribing, there was striking geographic variation (See Exhibit 3) in appropriate prescribing with further variation in the specific component of guideline non-adherence. In some areas physicians tended to prescribe high doses for new prescriptions, while in other areas, they prescribed for longer durations suggesting the need for tailored interventions based on location. For example, in Massachusetts, there was overall average performance in the composite measure of CDC-compliant prescribing when compared with national benchmarks, and the opportunity for improvement appears to relate to excessive opioid dosage, rather than prescription duration (See Exhibit 4).
Exhibit 3: County-based performance variation in selected opioid use quality measures, 2016
(blue=better performance)
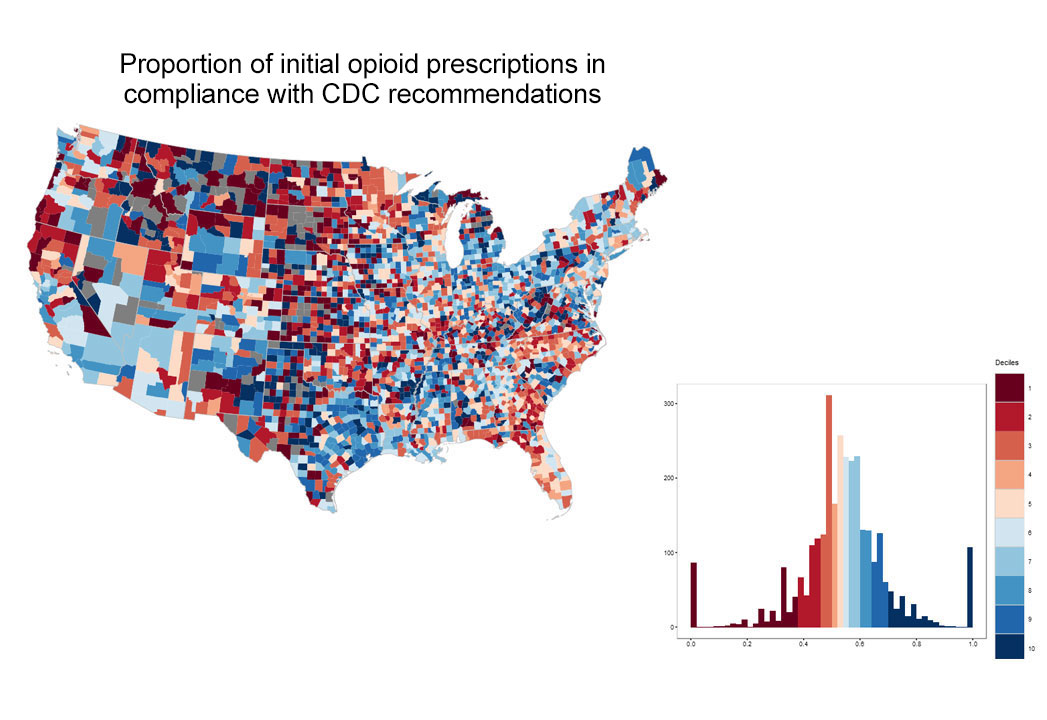
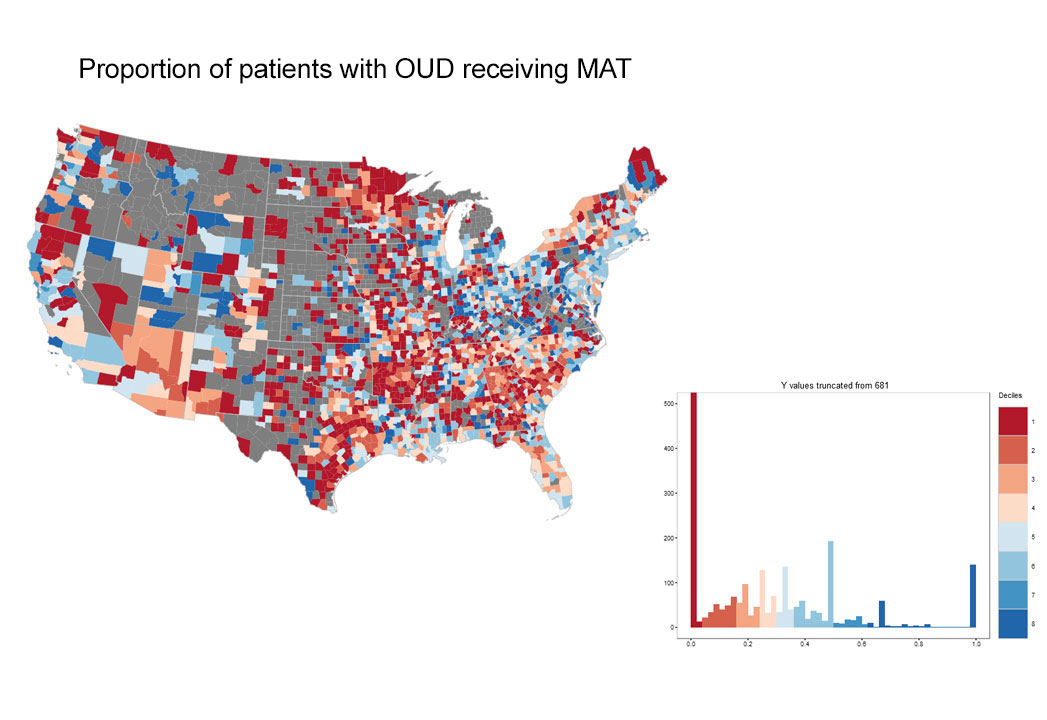

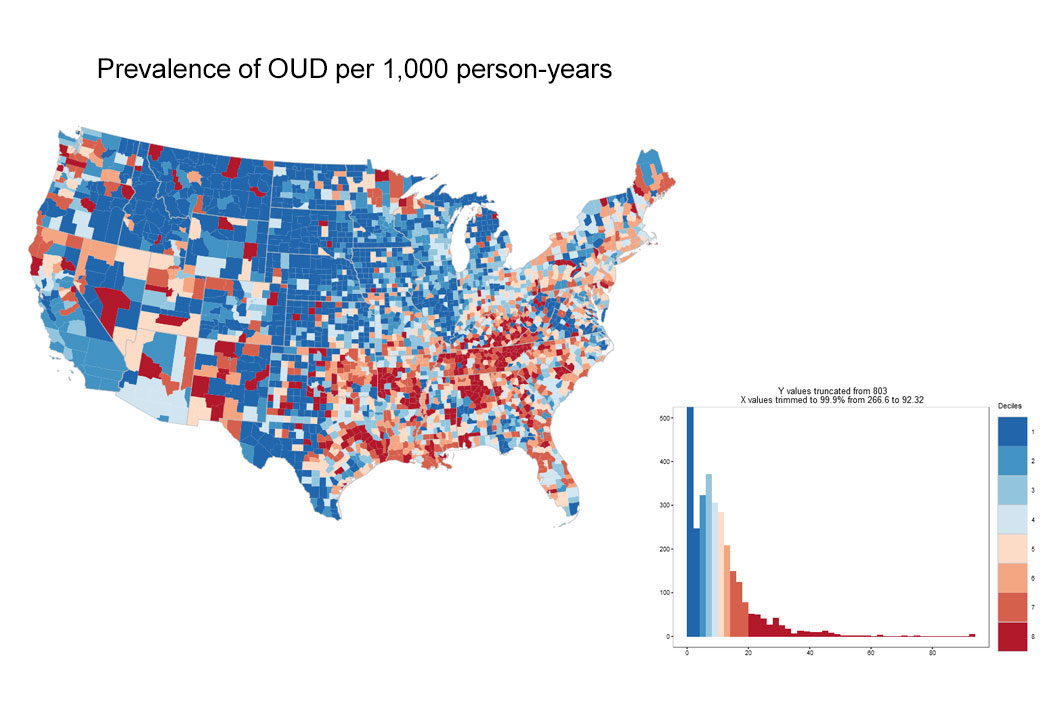
Source: OptumLabs Data Warehouse. Note: Blue indicates better performance. Grey areas indicate counties with insufficient data to calculate measures. Histograms depict performance on x-axis, and number of counties on y-axis.
Exhibit 4: County-based performance variation in selected opioid use quality measures, Massachusetts, 2016
(blue=better performance)
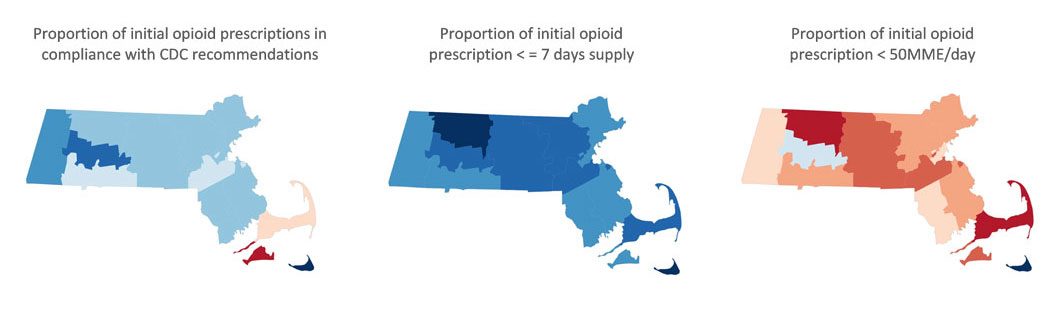
Source: OptumLabs Data Warehouse.
Encouragingly, in the pain rubric of Exhibit 1, post-operative pain appeared to be well-managed with 95 percent avoiding emergency department visits resulting in receipt of new opioids. Our claims based measures related to patients on chronic opioids showed moderate utilization of non-opioid drug treatment by these patients with about 45 percent receiving this treatment, and low use of non-drug treatments (roughly one in four patients). It should be noted that patients may be accessing some of these therapies outside the benefits of their current health insurance plans.
In the treatment rubric of Exhibit 1, rates of medication-assisted treatment (MAT) for OUD were approximately 28%, with a particular opportunity in those following overdose where rates of MAT were 11%. This is consistent with reported national trends. Additional data from our analysis suggests the relative prevalence of OUD increased 50 percent over the 2014-2016 time period, potentially due to both higher incidence and improved coding with ICD-10 adoption.
Moving forward with comprehensive framework
While traditionally developed performance metrics are essential, their value in managing acute crises is limited by an extended ratification process, a focus on one measure at a time, and delayed provider feedback. By offering a comprehensive diagnostic snapshot with benchmarked data on populations that can be attributed based on patients’ geography, payer, or provider, “just in time” comprehensive quality frameworks can enable public health agencies, integrated health care providers, and/or health plans to more rapidly benchmark their status and deploy and evaluate the impact of interventions.
Within our larger organization, for example, initiatives for safer prescribing via pharmacy benefit management, access to MAT via expanded provider networks, clinical and consumer education programs, and dozens of other programs are being pursued in various populations and geographic regions, and such a framework could help assess outcomes over time. To take one example, first-fill drug utilization rules were placed in effect in July 2017 by several hundred clients served by our organization, and within two months of implementation, initial review found relative reductions of 82 percent in excessive dosage and 65 percent reduction in excessive duration of new opioid prescriptions relative to CDC opioid best practice prescribing guidelines among this cohort. In this manner, “just in time” frameworks may permit a precision-medicine approach to the opioid epidemic based on a common set of data-driven metrics.
About the authors:
- Darshak Sanghavi, MD, is chief medical officer at OptumLabs
- Aylin Altan, PhD, is senior vice president of research at OptumLabs
- Christopher Hane, PhD, is vice president of data science at OptumLabs
- Paul Bleicher, MD, PhD, is chief executive officer at OptumLabs